
Purpose
This document explains how to configure logging in Visulox 5 using the Dashboard.
It covers:
-
Logging level
-
Local log rotation
-
Sentry integration
-
Loki integration
Installing or administering Sentry, Loki, or Grafana is outside the scope of this document.
For Grafana and Loki deployment and integration, please contact an integrator.
Overview
VISULOX records operational events from the Portal and connected Connectors.
Logs can be:
-
Stored locally on the Portal and Connector hosts.
-
Forwarded to Sentry for error monitoring.
-
Forwarded to Loki for centralized log collection.
The Logging page manages Portal and Connector service logs only. It does not manage Visulox Core logs, operating system logs, reverse proxy logs, browser logs, or application logs.
Logging Configuration
Sign in to the Visulox Dashboard as an administrator and navigate to:
Administration → System Settings → Logging
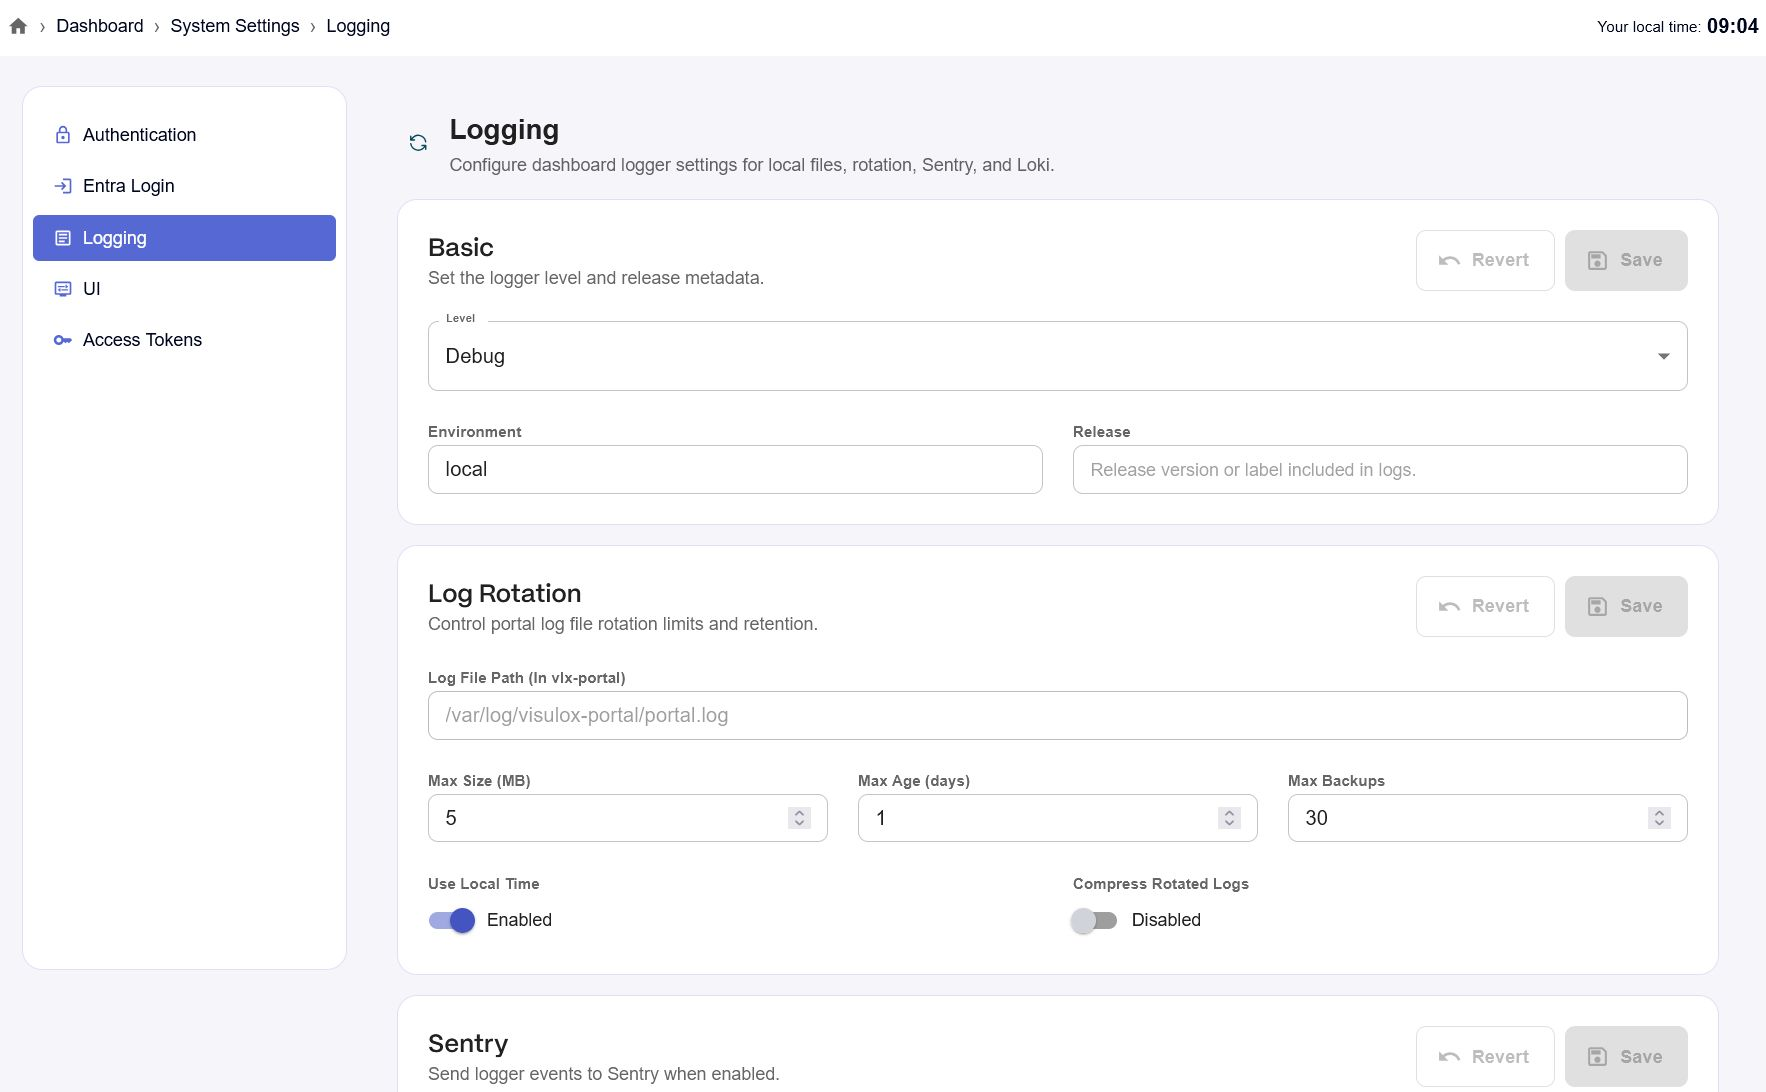
The Logging page contains four configuration sections:
-
Basic
-
Log Rotation
-
Sentry
-
Loki
Logging settings are configured centrally in the Dashboard and are automatically synchronized to connected Connectors.
Before configuring external logging, ensure:
-
You have administrator access to the Dashboard.
-
You have the required Sentry DSN or Loki connection information.
-
The Portal can reach the external logging service.
Basic Logging
The Basic section controls how much information Visulox records.
Available log levels are:
-
Panic
-
Fatal
-
Error
-
Warning
-
Info
-
Debug
-
Trace
Recommended Settings
|
Environment |
Recommended Log Level |
|---|---|
|
Production |
Info |
|
Troubleshooting |
Debug |
|
Support investigation |
Trace (temporarily) |
Higher log levels generate significantly more log data and should only be used for short troubleshooting sessions.
Changing the log level affects only newly generated log entries.
Log Rotation
Log rotation controls how local log files are retained.
Available settings include:
-
Maximum file size
-
Maximum file age
-
Maximum number of backup files
-
Use local time
-
Compress rotated logs
Configure these settings according to your organization's retention and storage requirements.
Local log file locations depend on the installation type. See the Visulox Monitoring & Log Inspection Guide for log locations and log inspection procedures.
Sentry Integration
Sentry is an optional error-monitoring platform.
To configure Sentry:
-
Obtain the Sentry DSN from your Sentry administrator.
-
Open the Sentry section.
-
Enable Sentry.
-
Enter the DSN.
-
Save the configuration.
Only new error events are forwarded after Sentry is enabled.
Loki Integration
Loki is an optional centralized logging platform.
To configure Loki:
-
Obtain the required connection information from your Loki administrator.
-
Open the Loki section.
-
Enter the required values.
-
Enable Loki.
-
Save the configuration.
Only new log entries are forwarded after Loki is enabled.
Grafana can be connected to Loki to search and visualize the collected logs.
Limitations
Keep the following in mind:
-
The Logging page manages Portal and Connector service logs only.
-
Existing log entries are not uploaded when Sentry or Loki is enabled.
-
Visulox Core logs and other system logs are managed separately.
-
Connected Connectors receive updated logging settings automatically after they synchronize with the Portal.
Verification
After saving the configuration:
-
Refresh the Logging page and verify that the settings were saved.
-
Generate normal Visulox activity.
-
Verify that local log files are being created and rotated.
-
If Sentry is enabled, verify that new error events appear in the configured Sentry project.
-
If Loki is enabled, verify that new log entries appear in Loki or Grafana.
Troubleshooting
|
Problem |
Check |
|---|---|
|
No logs appear in Sentry |
Verify the Sentry DSN and network connectivity. |
|
No logs appear in Loki |
Verify the Loki connection information and network connectivity. |
|
Connector logs are missing |
Verify that the Connector is connected to the Portal and has synchronized its configuration. |
|
Local logs consume too much disk space |
Reduce the log level or adjust the log rotation settings. |